Physiological Breeding
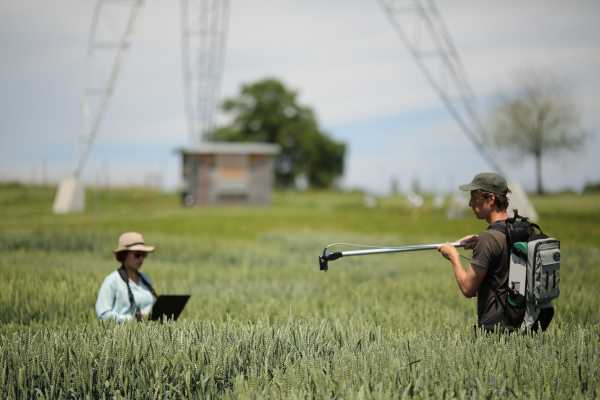
Together with our partners, we aim to bring new phenotyping methods into the nursery.
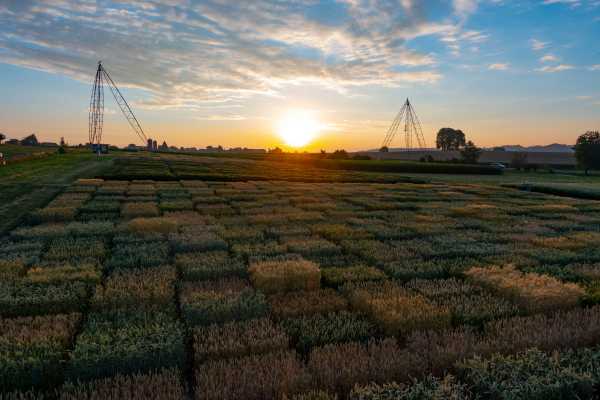 Hand harvest of seeds for next year.
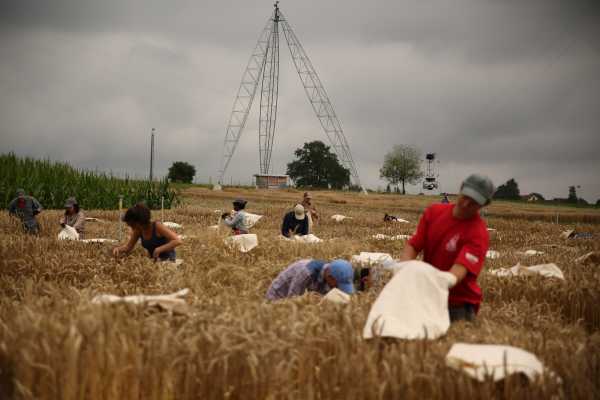 "Ground truth" measurements in the FIP.
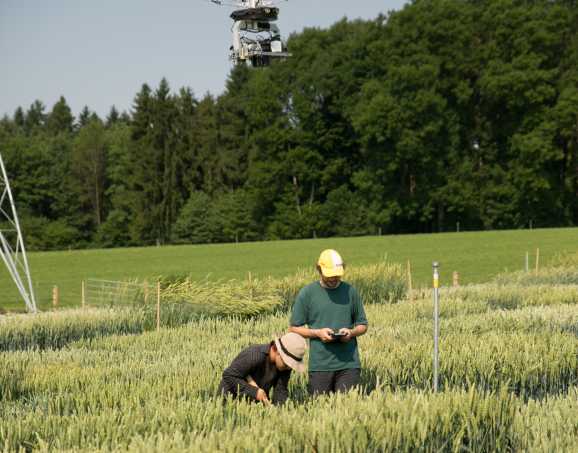 Hyperspectral reflectance measurements.
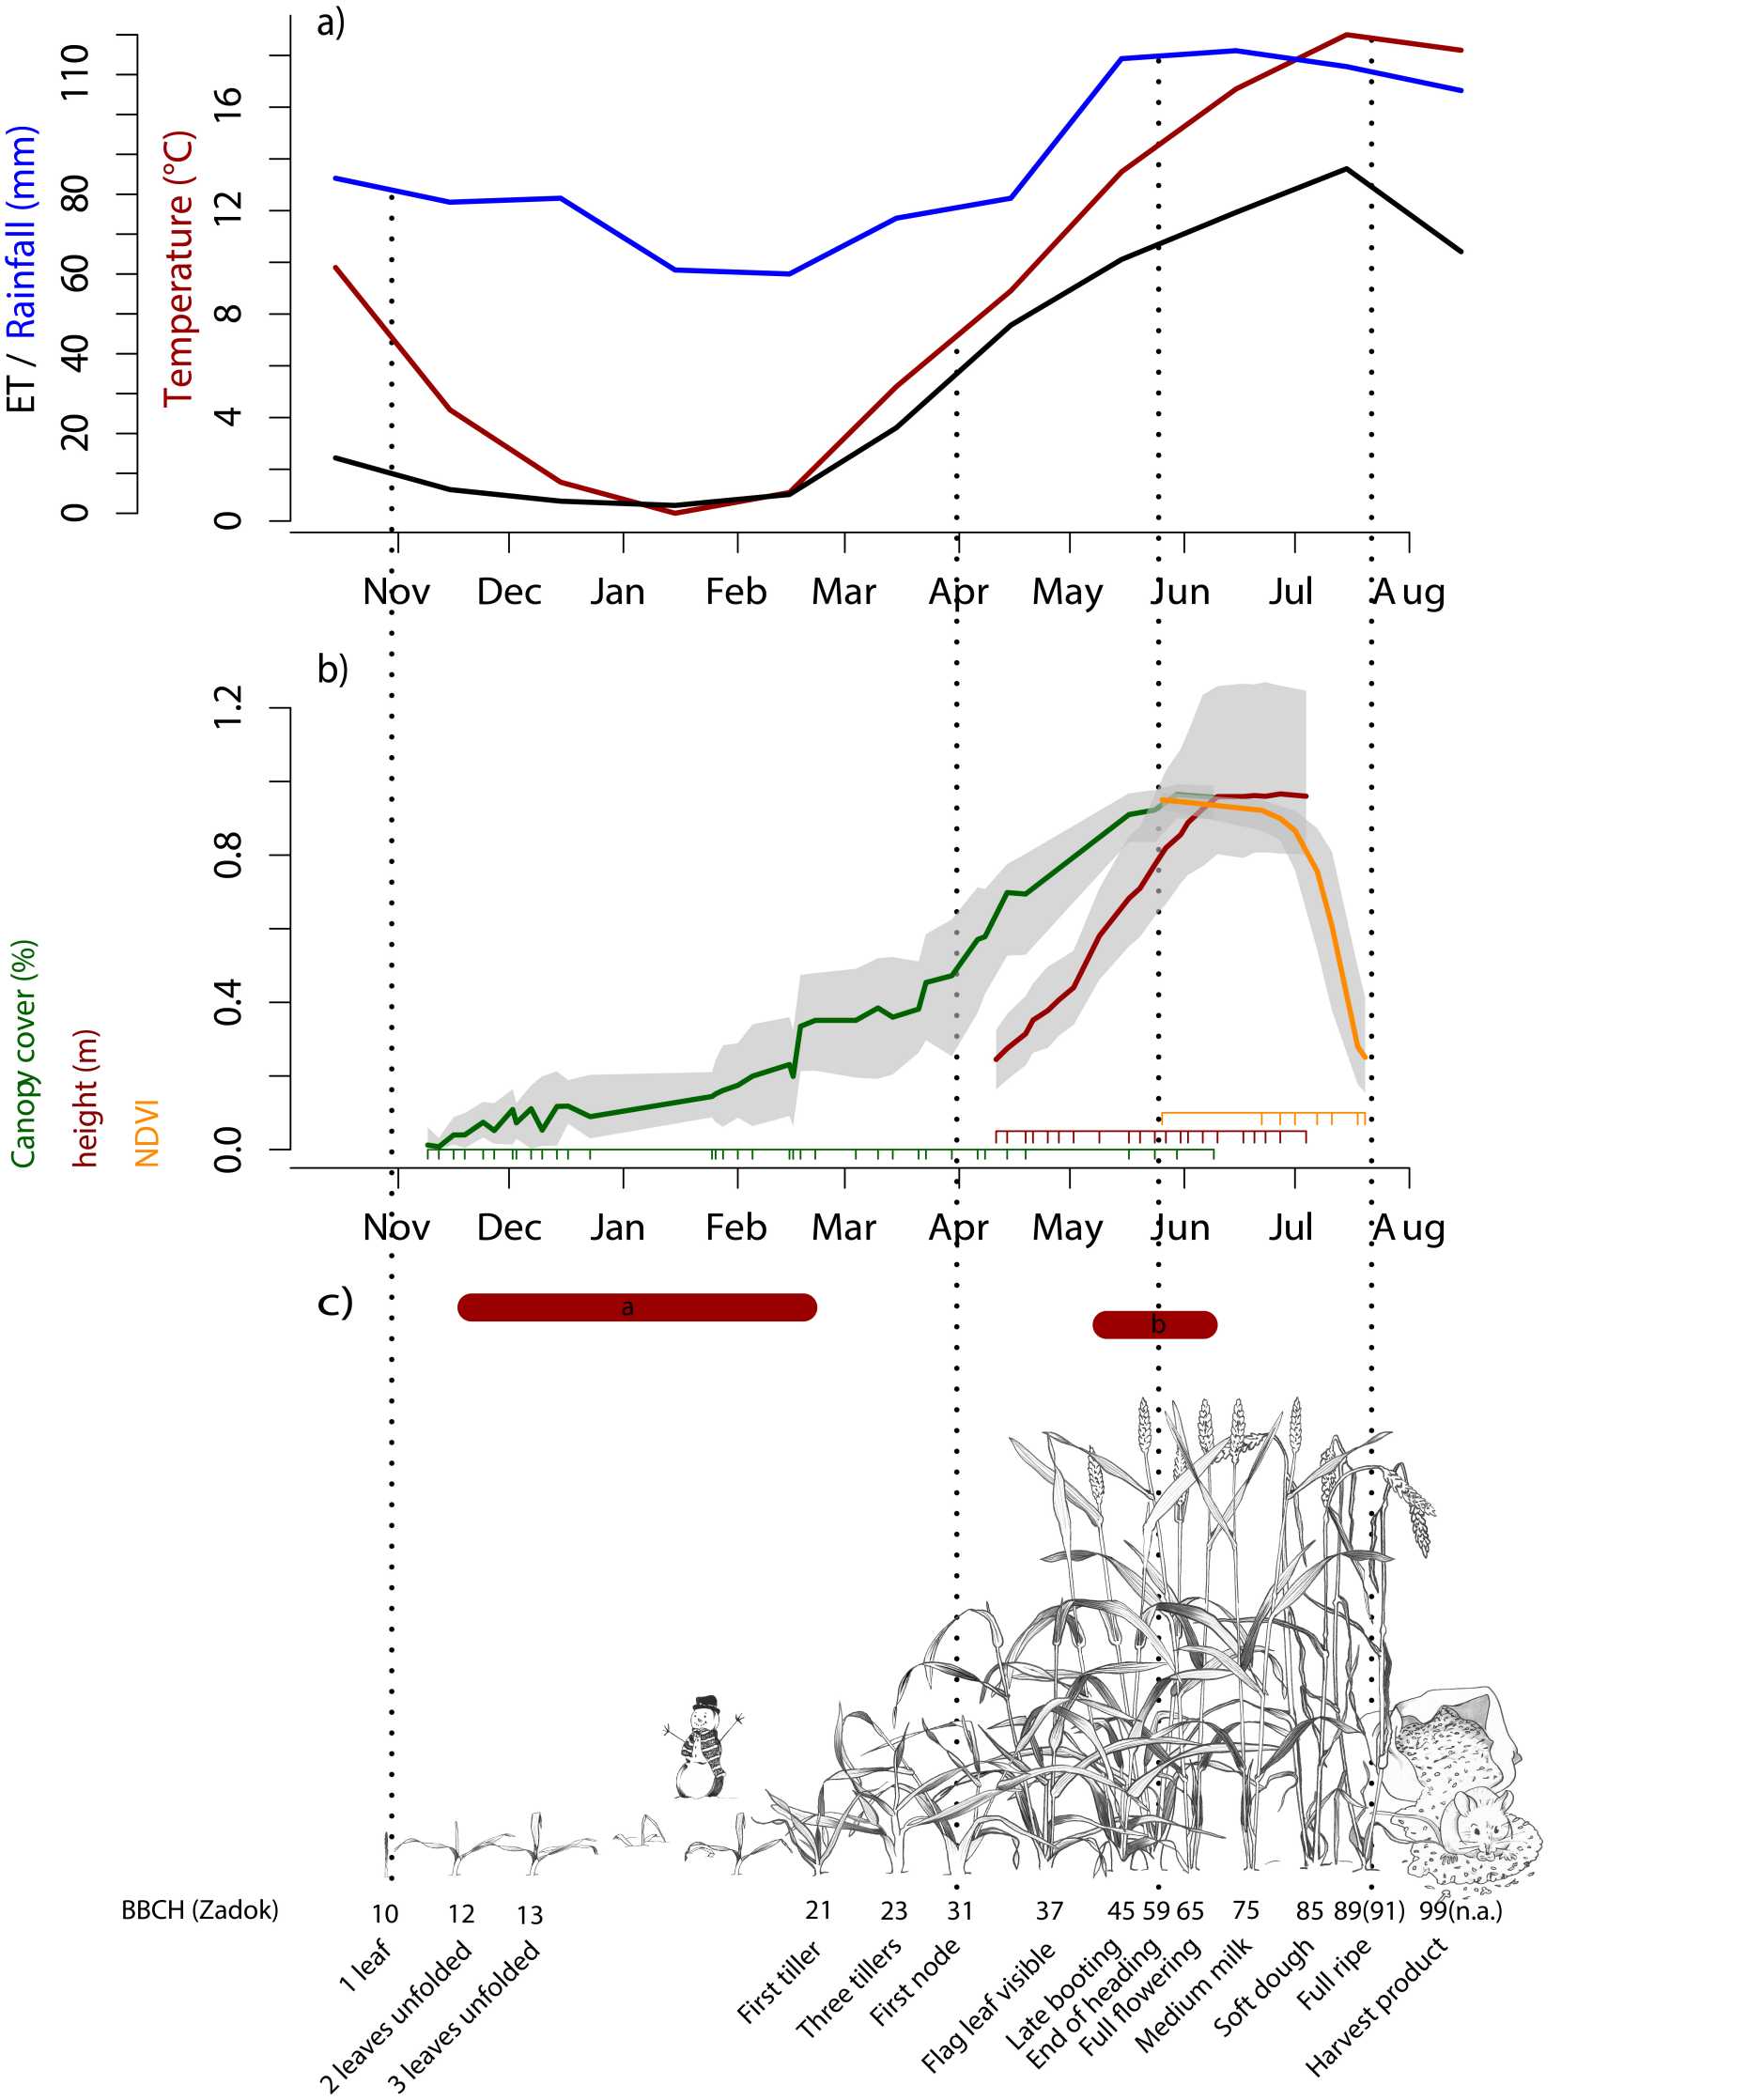
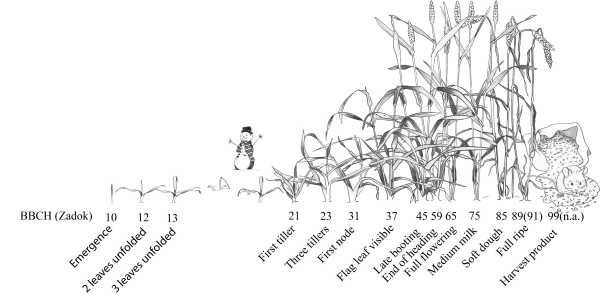
 Critical stages of winter wheat according to BBCH (Lancashire et al., 1991) and their deviations from the Zadok’s scale (in brackets). The spacing between the stages follows calendar time for the temperate climate of Switzerland.
We develop high-throughput field phenotyping methodologies to enhance the genetic gain of yield and yield stability of wheat and other crops in the field. Specifically, we aim i) to achieve a deeper understanding of the genetic control of developmental processes during critical phases of crop development and ii) to develop phenotyping methodologies and genetic crop models to predict the performance of new breeding lines depending on the target environment and climate scenario. To achieve this, we follow two lines of research: i) continuous phenotyping of wheat throughout its development using the Field Phenotyping Platform (FIP) and the Phenofly infrastructure and ii) intense and close collaboration with breeders in the framework of TraitSpotting to close the gap between crop physiology and applied breeding. The data are managed by means of the crop phenotyping database (CroPyDB).
Achievements: We developed a range of high-throughput methodologies to evaluate the performance of wheat as it develops during the growing season (external page Hund et al. 2019). These traits comprise i) temperature-response and phenological development during winter (Grieder, Hund, and Walter 2015; Yu et al. 2017) and during stem elongation (Kronenberg et al. 2017; 2020) ii) the rate and timing of senescence (Anderegg et al. 2020) as well as the quantification of Septoria Tritici Blotch (Anderegg et al. 2019; Yu et al. 2018). To upscale these methodologies to breeding application, the group recently put more focus on drone-based phenotyping of large numbers of field plots (ethz.ch/traitspotting) including flight planning (Roth et al., 2018) and protocols for thermal imaging (Perich et al., 2020). The group also developed a method for repeated multi-view imaging for estimating seedling tiller counts of wheat genotypes using drones (Roth et al., 2020)
Figure: Climate normal of evapotranspiration (ET), temperature and rainfall in the reference period 1981–2010 for Zurich Affoltern as typical site in the Swiss central plateau. MeteoSchweiz (external page 2016): (a) Development of canopy cover (image segmentation; Yu et al., 2017), plant height (terrestrial laser scanning point clouds; Kronenberg et al., 2017) and senescence (NDVI derived from canopy reflectance with ASD FieldSpec® 4 spectroradiometer; in the field phenotyping platform of ETH Zurich in 2016. (b) Ticks indicate measuring times. Shaded areas depict the 5th and 95th percentile of phenotypic values measured on the ~300 genotypes of the GABI wheat association panel representing breeding material from central and northern Europe (external page Zanke et al., 2014). Illustration of major developmental stages of wheat (external page Schürch et al., 2018). (c) Stages according to BBCH (external page Lancashire et al., 1991); cases where Zadoks’s scale deviates in brackets. Major critical phase for winter survival (red bar a) and grain set (red bar b). Dotted vertical lines connect the important stages related to points-of-no-return, which are regularly assessed by breeders: full emergence, end of tillering/beginning of stem elongation, end of heading/ beginning of lowering and ripeness (Source: external page Hund et al. 2019)
